- SpringCloud整合nacos配置中心bootstrap.yml
- Java Spring 通过 AOP 实现方法参数的重新赋值、修改方法
- 鲜花商城系统设计与实现(Java+Web+MySQL)
- 详解Spring Boot中@value的使用方式
- MySQL中的多表查询详解
- 数据库系统原理及MySQL应用教程实验九数据库的安全机制管理
- 数据库实战:基于Tkinter+MySQL的学生成绩管理系统
- 【Linux-编译器gccglibc升级】CentOS7.9使用Nod
- Dubbo快速入门 —— 基于SpringBoot Starter 开
- Spring Boot + MinIO 实现文件切片极速上传技术
- Go语言中的gin框架之【GETPOST】请求参数接收传值(五)
- 快速入门使用spring详细步骤(介绍、导入依赖、第一个简单程序)
- springboot三层架构解决报错信息:o.a.c.c.C.[.[.
- 基于JAVA的学生信息管理系统
- nginx [alert] could not open error
- 解决 Caused by: net.sf.jsqlparser.par
- nginx常见漏洞解析
- 【工具】IDEA开发常用配置-编码设置、自动导包、类注释、方法注释、提
- MySQL数据库——MySQL REGEXP:正则表达式
- SpringBoot3之配置文件(学习SpringBoot3的配置这一
- MySQL8.0.32详细安装教程(奶妈级手把手教你安装)
- 【SpringBoot快速入门】(2)SpringBoot的配置文件与
- 【MySQL】 IS NOT NULL 和 != NULL 的区别?
- MS SQL Server 查看存储过程
- MySQL 教程 1.4
- 前端开发新趋势:Web3、区块链和虚拟现实
- Apache SeaTunnel:新一代高性能、分布式、海量数据集成工
- Tomcat的部署
- 【Spring Cloud】基于 Feign 实现远程调用,深入探索
- 详解Xss 及SpringBoot 防范Xss攻击(附全部代码)
案例背景
最近总看到《消失的她》票房多少多少,《孤注一掷》票房又破了多少多少.....
于是我就想自己爬虫一下获取中国高票房的电影数据,然后分析一下。
数据来源于淘票票:影片总票房排行榜 (maoyan.com)
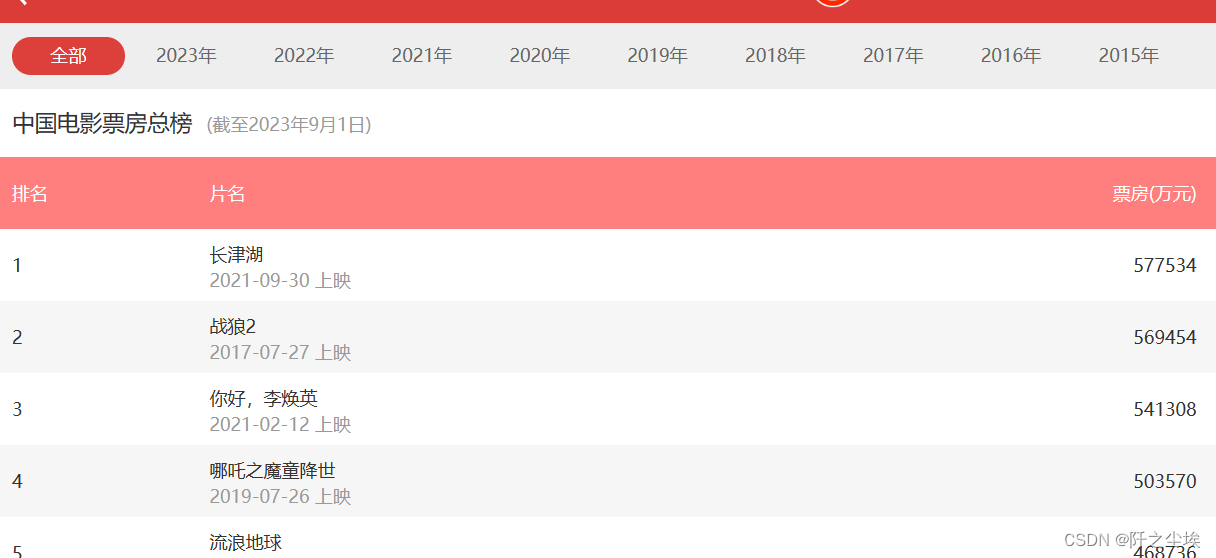
爬它就行。
代码实现
首先爬虫获取数据:
数据获取
导入包
import requests; import pandas as pd
from bs4 import BeautifulSoup
传入网页和请求头
url = 'https://piaofang.maoyan.com/rankings/year'
headers = {'User-Agent': 'Mozilla/5.0 (Windows NT 10.0; Win64; x64) AppleWebKit/537.36 (KHTML, like Gecko) Chrome/116.0.0.0 Safari/537.36 Edg/116.0.1938.62'}
response1 = requests.get(url,headers=headers)
response.status_code

200表示获取网页文件成功
然后解析网页文件,获取电影信息数据
%%time
soup = BeautifulSoup(response.text, 'html.parser')
soup=soup.find('div', id='ranks-list')
movie_list = []
for ul_tag in soup.find_all('ul', class_='row'):
    movie_info = {}
    li_tags = ul_tag.find_all('li')
    movie_info['序号'] = li_tags[0].text
    movie_info['标题'] = li_tags[1].find('p', class_='first-line').text
    movie_info['上映日期'] = li_tags[1].find('p', class_='second-line').text
    movie_info['票房(亿)'] = f'{(float(li_tags[2].text)/10000):.2f}'
    movie_info['平均票价'] = li_tags[3].text
    movie_info['平均人次'] = li_tags[4].text
    movie_list.append(movie_info)
数据获取完成了! 查看字典数据:
movie_list
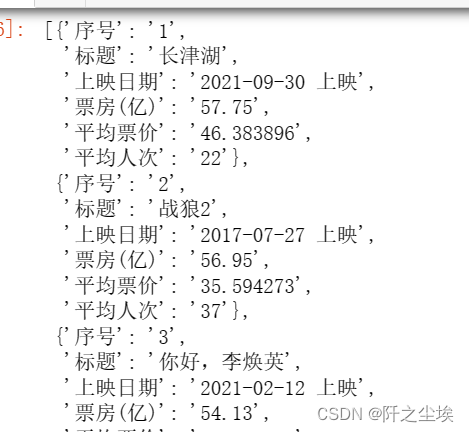
可以,很标准,没什么问题,然后把它变成数据框,查看前三行
movies=pd.DataFrame(movie_list)
movies.head(3)

对数据进行一定的清洗,我们看到上映日期里面的数据有“上映”两个字,我们要去掉,然后把它变成时间格式,票房,票价,人次都要变成数值型数据。
我们只取票房前250的电影,对应豆瓣250.,,,,中国票房250好叭
然后我们还需要从日期里面抽取年份和月份两列数据,方便后面分析。
#清洗
movies=movies.set_index('序号').loc[:'250',:]
movies['上映日期']=pd.to_datetime(movies['上映日期'].str.replace('上映',''))
movies[['票房(亿)','平均票价','平均人次']]=movies.loc[:,['票房(亿)','平均票价','平均人次']].astype(float)
movies['年份']=movies['上映日期'].dt.year  ;   movies['月份']=movies['上映日期'].dt.month
movies.head(2)

数据处理完毕,开始画图分析!
画图分析
导入画图包
import seaborn as sns
import matplotlib.pyplot as plt
plt.rcParams ['font.sans-serif'] ='SimHei'               #显示中文
plt.rcParams ['axes.unicode_minus']=False
对票房排名前20的电影画柱状图
top_movies = movies.nlargest(20, '票房(亿)')
plt.figure(figsize=(7, 4),dpi=128)
ax = sns.barplot(x='票房(亿)', y='标题', data=top_movies, orient='h',alpha=0.5)
#plt.xticks(rotation=80, ha='center')
# 在柱子上标注数值
for p in ax.patches:
    ax.annotate(f'{p.get_width():.2f}', (p.get_width(), p.get_y() + p.get_height() / 2.),
                va='center', fontsize=8, color='gray', xytext=(5, 0),
                textcoords='offset points')
plt.title('票房前20的电影')
plt.xlabel('票房数量(亿)')
plt.ylabel('电影名称')
plt.tight_layout()
plt.show()
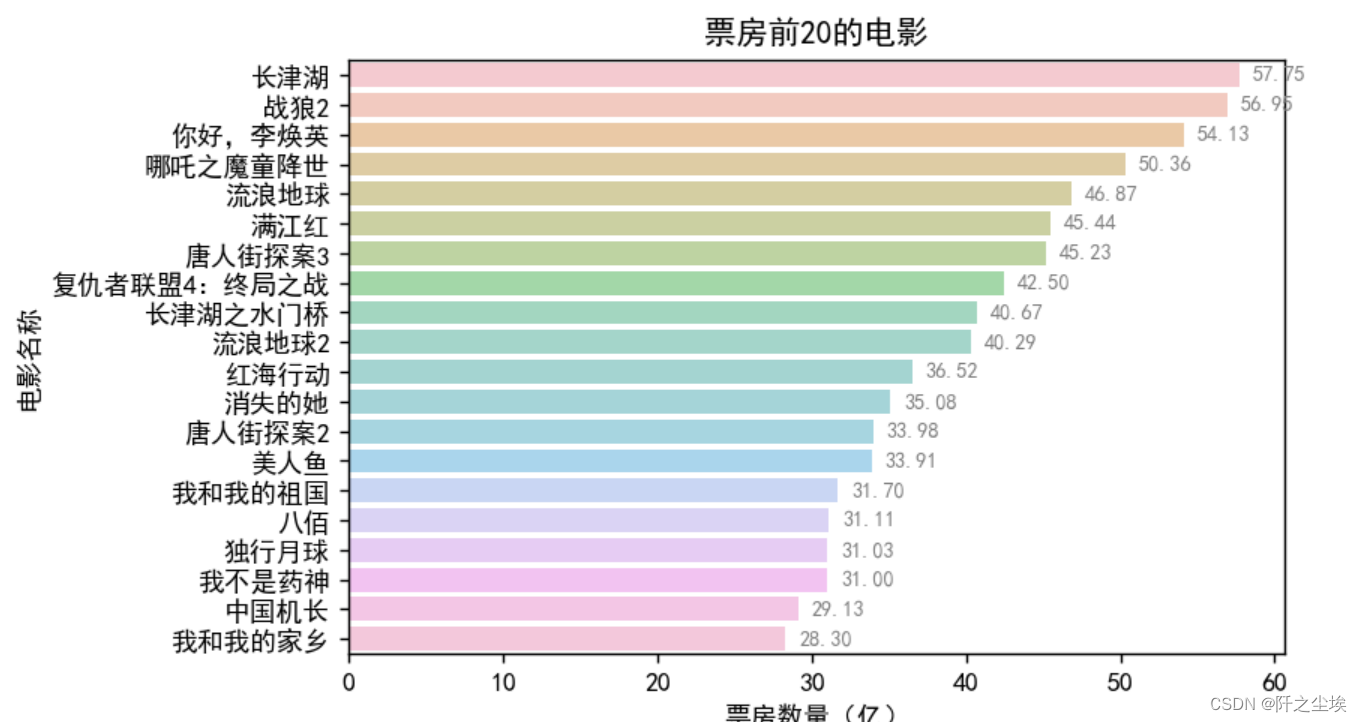
还不错,很好看,可以看到中国历史票房前20 的电影名称和他们的票房数量。
对平均票价和平均人次进行分析:
plt.figure(figsize=(7, 6),dpi=128)
# 绘制第一个子图:平均票价点图
plt.subplot(2, 2, 1)
sns.scatterplot(y='平均票价', x='年份', data=movies,c=movies['年份'],cmap='plasma')
plt.title('平均票价点图')
plt.ylabel('平均票价')
#plt.xticks([])
plt.subplot(2, 2, 2)
sns.boxplot(y='平均票价', data=movies)
plt.title('平均票价箱线图')
plt.xlabel('平均票价')
plt.subplot(2, 2, 3)
sns.scatterplot(y='平均人次', x='年份', data=movies,c=movies['年份'],cmap='plasma')
plt.title('平均人次点图')
plt.ylabel('平均人次')
plt.subplot(2, 2, 4)
sns.boxplot(y='平均人次', data=movies)
plt.title('平均人次箱线图')
plt.xlabel('平均人次')
plt.tight_layout()
plt.show()
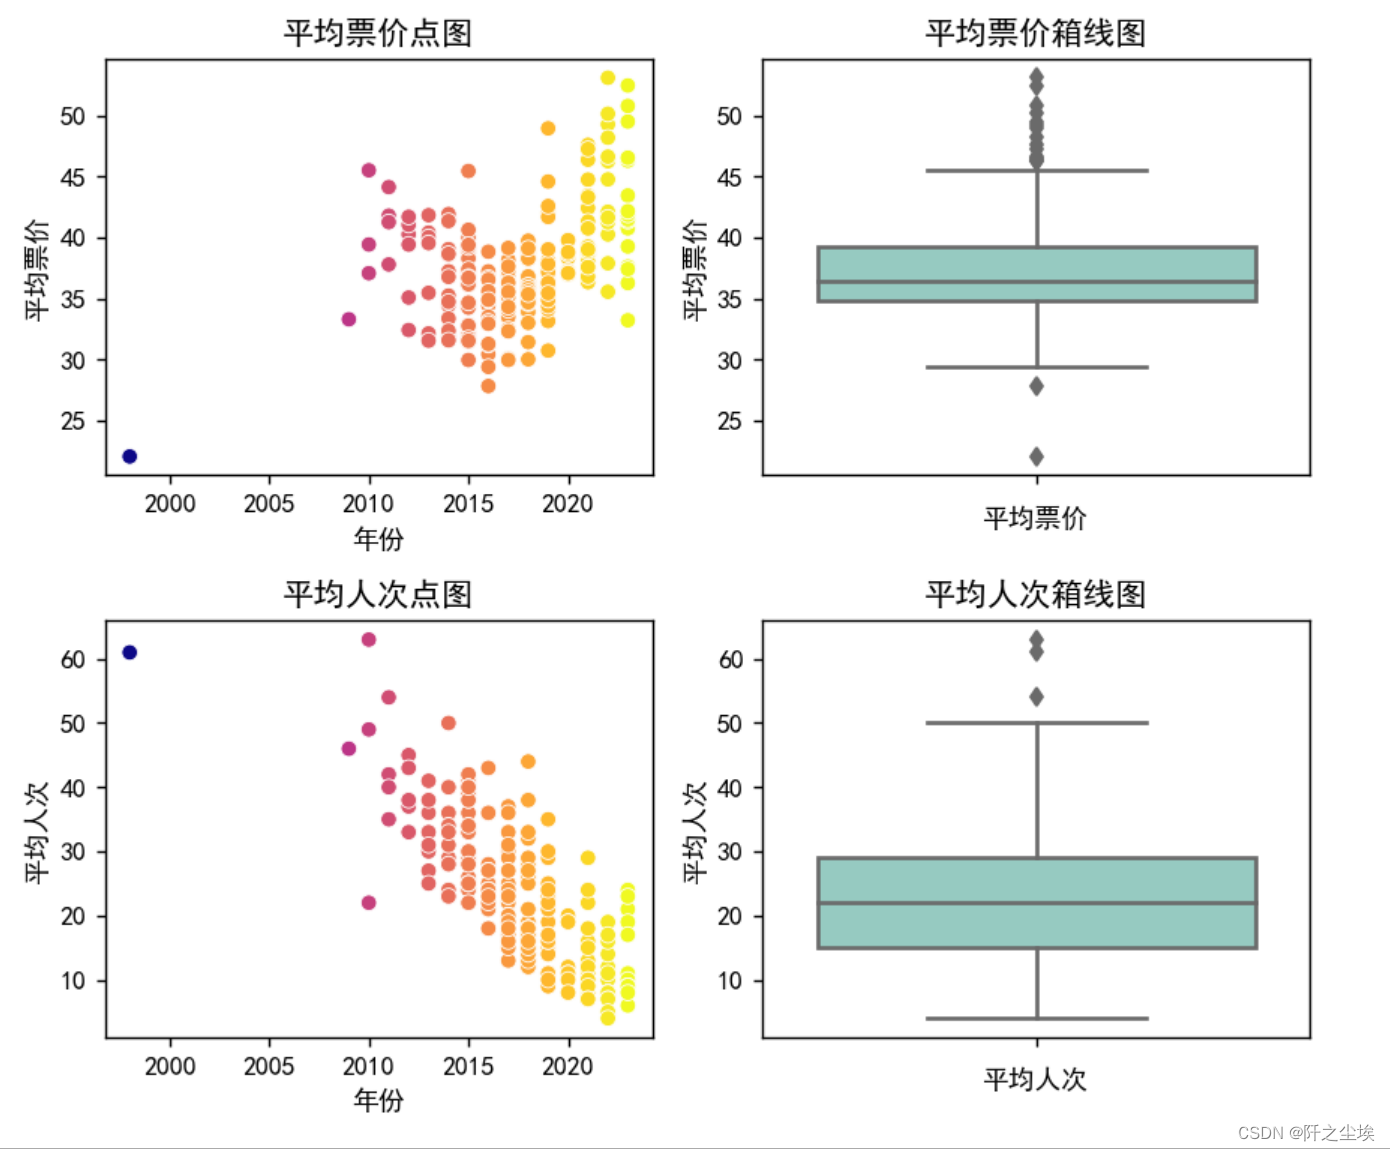
先看柱状图,可以看到平均票价和平均人次都是有一些离群点的,然后我们在左边画了他们和年份的的散点图,可以明细看到,随着年份越大,电影的平均人次越来越低,平均票价越来越高.....也就是最近的电影比起之前的电影来说,越来越贵,而且平均每场看的人越来越少......也侧面反映了我国电影业的一些“高票价”,‘幽灵剧场刷票房’ 等等乱象...
我注意到2000年之前有一个电影每场人次特别高,票价很低,它是什么电影我很好奇我就查看了一下:
movies[movies['年份']<2000]

原来是国民级别的《泰坦尼克号》,那没事了,名副实归。
不同年份的高票房电影数量:
plt.figure(figsize=(7, 3), dpi=128)
year_count = movies['年份'].value_counts().sort_index()
sns.lineplot(x=year_count.index, y=year_count.values, marker='o', lw=1.5, markersize=3)
plt.fill_between(year_count.index, 0, year_count, color='lightblue', alpha=0.8)
plt.title('不同年份高票房电影数量')
plt.xlabel('年份')
plt.ylabel('电影数量')
# 在每个数据点上标注数值
for x, y in zip(year_count.index, year_count.values):
    plt.text(x, y+0.2, str(y), ha='center', va='bottom', fontsize=8)
plt.tight_layout()
plt.show()
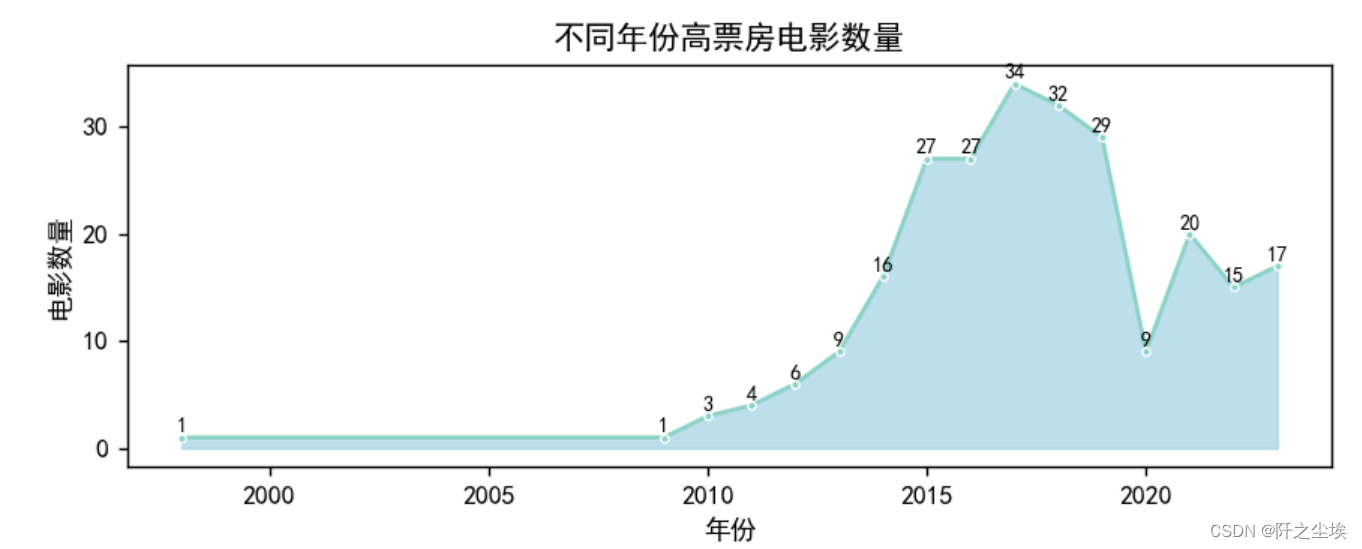
可以看到,我国高票房的电影,从2010年开始高速增长,到2017年到达峰值,著名的《战狼2》就是2017年上映的,然后2018和2019略微下降,2020年断崖下跌,,为什么,懂得懂得,疫情原因嘛。
对高票房电影不同月份的占比百分比分析:
plt.figure(figsize=(4, 4),dpi=128)
month_count = movies['月份'].value_counts(normalize=True).sort_index()
# 绘制饼图
sns.set_palette("Set3")
plt.pie(month_count, labels=month_count.index, autopct='%.1f%%', startangle=140, counterclock=False,
        wedgeprops={'alpha': 0.9})
plt.axis('equal')  # 保证饼图是正圆形
plt.text(-0.3,1.2,'不同月份高票房电影数量',fontsize=8)
plt.tight_layout()
plt.show()
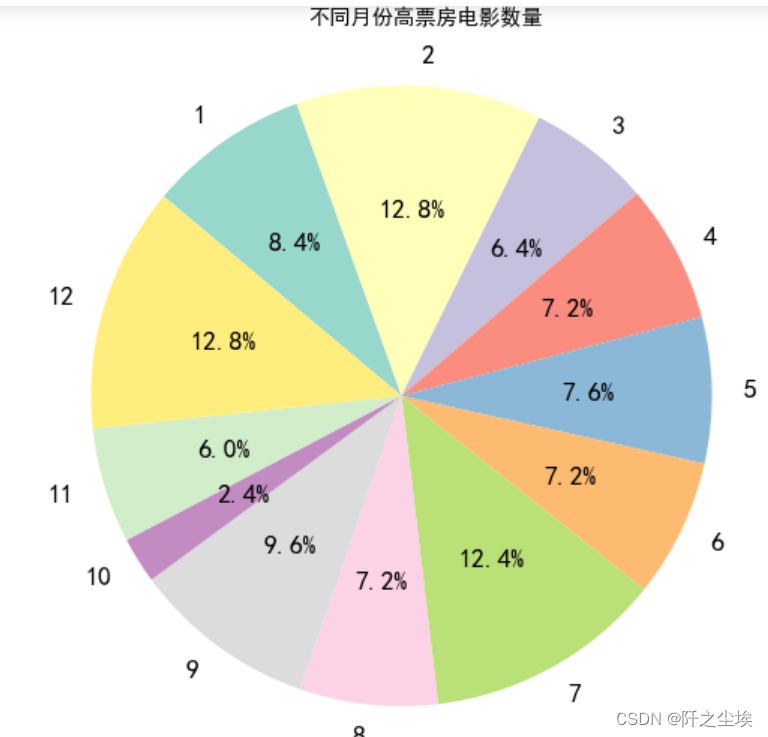
我们可以看到,高票房电影主要集中在2月,7月,12月,三个月份区间。
理由也很简单,2月春节,7月暑假,12月跨年.....电影都喜欢这三个时间段上映。
自定义评价指标
我们上面都是之间拿票房进行分析的,我们发现,票房高的电影真的是反映了看的人多嘛?它真的是受观众喜欢的好电影嘛?
数据有限,虽然我们无法剔除宣传,时间热点,导演,社会风气等等影响因素,但是我们可以把票价进行一定的控制。因为票房高的电影也有可能是票价过高造成的,所以我们用‘票房/平均票价’,然后和‘平均人次’进行一个加权求和。
票房/平均票价 表示看电影的人群量,给7成权重,平均人次 给一个3层的权重,然后都进行标准化统一数据单位,加起来就成为我们自己的评价指标:
为了方便标准化我们先导入一个机器学习库里面sklearn的标准化函数
from sklearn.preprocessing import StandardScaler
scaler = StandardScaler()
计算指标:
movies['我的评价指标']=(movies['票房(亿)'].astype(float)/movies['平均票价'].astype(float))
data1=scaler.fit_transform(movies[['我的评价指标', '平均人次']])
movies['我的评价指标']=0.7*data1[:,0]+0.3*data1[:,1]
movies=movies.sort_values(by='我的评价指标',ascending=False)
画图查看:
my_top_movies = movies.nlargest(20, '我的评价指标')
plt.figure(figsize=(7, 4),dpi=128)
ax = sns.barplot(x='我的评价指标', y='标题', data=my_top_movies, orient='h',alpha=0.6,palette='rainbow_r')
#plt.xticks(rotation=80, ha='center')
# 在柱子上标注数值
for p in ax.patches:
    ax.annotate(f'{p.get_width():.2f}', (p.get_width(), p.get_y() + p.get_height() / 2.),
                va='center', fontsize=8, color='gray', xytext=(5, 0),
                textcoords='offset points')
plt.title('前20电影')
plt.xlabel('我的评价指标')
plt.ylabel('电影名称')
plt.tight_layout()
plt.show()
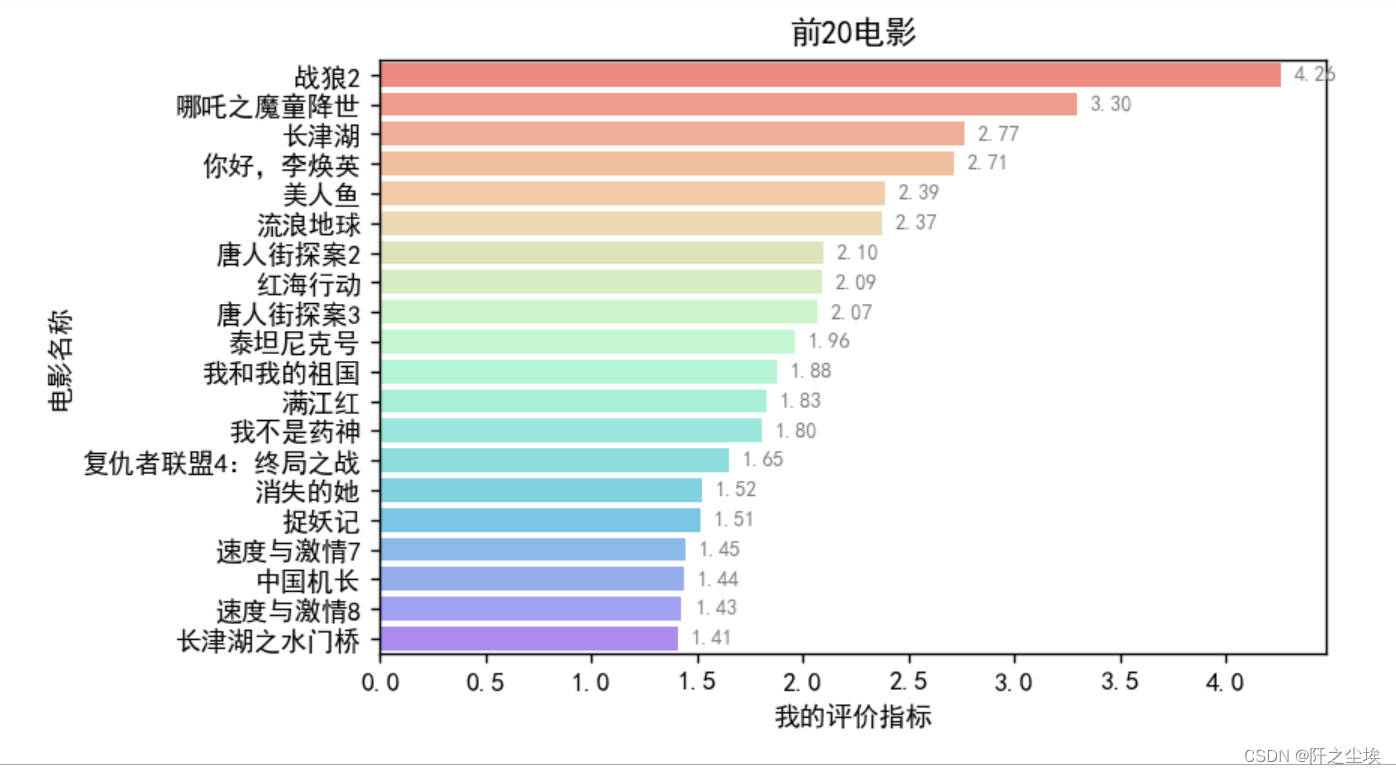
和之前的最高票房前20 的作对比,这样我们能比较哪些是票房过高的电影,哪些是可能被低估的电影。
def get_unique_elements(list1, list2):
    # 获取每个列表中的唯一元素
    set1 = set(list1) ; set2 = set(list2)
    unique_to_list1 = list(set1 - set2)
    unique_to_list2 = list(set2 - set1)
    common_elements = list(set1 & set2)
    return unique_to_list1, common_elements, unique_to_list2
票价过高的电影,确实是好电影,被低估的电影=get_unique_elements(top_movies['标题'].to_list(), my_top_movies['标题'].to_list())
这个函数的作用是选出第一个列表特有的元素,两个列表共有的元素,第二个列表特有的元素。
若这个电影在票房前20里面,也在我们的评价指标前20里面,那么就是好电影。若它在在票房前20里面,不在我们的评价指标前20里面,那可能就是票价过高的“水分电影”。
print(f'票价过高的电影:{票价过高的电影},\n\n确实是好电影:{确实是好电影},\n\n低估的电影:{被低估的电影}')

票价过高的电影:['八佰', '我和我的家乡', '独行月球', '流浪地球2'],emmmm
这几个电影,我都没怎么深入了解就不评价了......
词云图
加个词云图吧,好看些:
先自定义一个随机颜色函数:
import numpy as np
def randomcolor():
    colorArr = ['1','2','3','4','5','6','7','8','9','A','B','C','D','E','F']
    color ="#"+''.join([np.random.choice(colorArr) for i in range(6)])
    return color
[randomcolor() for i in range(3)]
然后画词云图:这里用了垫图掩码,原始图片形状为这样的六角星:—— 
from wordcloud import WordCloud
from matplotlib import colors
from imageio.v2 import imread    #形状设置
mask = imread('词云.png')
# 将'标题'和'票房'列合并为字典,以便生成词云图
word_freq = dict(zip(movies['标题'], movies['票房(亿)']))
color_list=[randomcolor() for i in range(20)]
wordcloud = WordCloud(width=1000, height=500, background_color='white',font_path='simhei.ttf',
                      max_words=50, max_font_size=50,random_state=42,mask = mask,
                          colormap=colors.ListedColormap(color_list)).generate_from_frequencies(word_freq)
plt.figure(figsize=(10, 5),dpi=256)
plt.imshow(wordcloud, interpolation='bilinear')
plt.axis('off')
plt.show()

总结
本次演示了从数据爬虫获取,到清洗整理,再到计算和可视化分析的全流程,再多加点图和文字分析角度,加点模型,作为大多数的本科生的论文算是差不多的工作量了。


